Introduction
Our Mission & Vision
At Rush University, the Department of Occupational Therapy is dedicated to excellence in education, service, scholarship, and health care delivery through our unique Practitioner-Teacher-Investigator model. We foster an inclusive learning community that values diversity and prepares future leaders in the profession.
Our vision is to be a nationally recognized leader in occupational therapy—advancing education, scholarship, service, and innovative academic-clinical partnerships that shape the future of health care.
Hands-On Learning & Innovative Training
Our Occupational Therapy Doctorate (OTD) Program combines academics and clinical experiences to develop highly skilled practitioners.
Students in the Rush University OTD Program will have hands-on clinical experiences every semester of the program, including the following:
- Directed observations within Rush University Medical Center and community partners
- Group dynamics
- Fieldwork experiences
- Individualized capstone experiences
These experiences expose you to diverse patient populations across a variety of settings, both on and off campus.
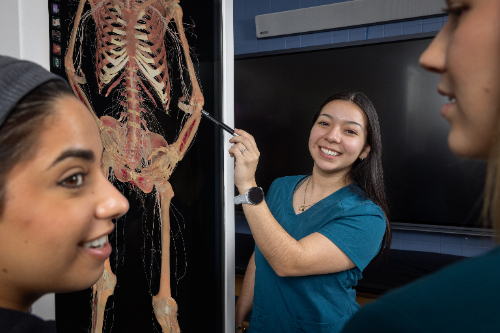
The program utilizes cutting-edge technology that brings the educational experience to a higher level. This includes our Anatomage tables, Moxie Learning Robots, Virtual Reality, 3D printing and more.
Our commitment to providing the best resources for our students is unwavering, and these innovative learning supports are a testament to that dedication.
Our program is currently ranked among the top occupational therapy programs in the nation, according to U.S. News & World Report.
You’ll learn from faculty who are also practicing occupational therapists at one of the nation’s top academic medical centers, Rush University Medical Center.
Our program utilizes the practitioner-teacher-investigator model, which allows students to learn from faculty who are active in practice and affords students opportunities to engage in clinical experiences throughout each semester of the curriculum and actively engage in research.
The program’s National Board for Certification in Occupational Therapy (NBCOT) exam outcomes are consistently above the average national exam pass rates. You can view the NBCOT certification pass rates for Rush graduates online.
Accreditation summary for the Occupational Therapy Doctorate program
The entry-level OTD program at Rush University has been approved by the Illinois Board of Higher Education.
The program is fully accredited by the Accreditation Council for Occupational Therapy Education (ACOTE) of the American Occupational Therapy Association (AOTA), located at:
7501 Wisconsin Avenue, Suite 510E
Bethesda, MD 20814
Phone: 301-652-AOTA
| Graduation year | Number of students matriculated (g2) | Students that withdrew due to reasons not related to academic and clinical performance (g3) | Number of on-time graduates (g1) | On-time graduation rate* | Overall graduation rate** |
|---|---|---|---|---|---|
| 2020 | 36 | 0 | 36 | 100% | 100% |
| 2021 | 36 | 1 | 34 | 97% | 97% |
| 2022 | 37 | 1 | 36 | 100% | 100% |
| 2023 | 38 | 0 | 38 | 100% | 100% |
| 2024 | 36 | 0 | 36 | 100% | 100% |
| 2025 | 36 | 1 | 31 | 89% | 94% |
| 2026 | 34 | 0 | 33 | 97% | 97% |
| 2027 | 40 | Not yet available | Not yet available | Not yet available | Not yet available |
| 2028 | 38 | Not yet available | Not yet available | Not yet available | Not yet available |
*In accordance with 2023 ACOTE Standard A.6.5 Graduation Rate is defined by the number of students who graduate on time (g1) divided by the number of students admitted in the original cohort (g2) minus the number of students who withdrew due to military, health, family issues, death and other reasons not related to academic and clinical performance (g3 .calculation per calendar year is = (g1/(g2-g3). On time (G1) = the number of students who graduated according to the published program length. If a student does not graduate according to the published program length, they should not be counted in any graduation rate.
** “Overall graduation” rate refers to the students that took more than 8 semesters to complete the program but did graduate.
Data is calculated by calendar year
3-year totals and average program graduation rates
| 3-year total number of students matriculated (g2) | 3-year total students that withdrew due to reasons not related to academic and clinical performance (g3) | 3-year total number of graduates (g1) | 3-year on-time average graduation rate* | 3-year average graduation rate* |
|---|---|---|---|---|
| 106 | 1 | 100 | 95% | 97% |
*Graduation years 2024, 2025, 2026
** In accordance with 2023 ACOTE Standard A.6.5 Graduation Rate is defined by the number of students who graduate on time (g1) divided by the number of students admitted in the original cohort (g2) minus the number of students who withdrew due to military, health, family issues, death and other reasons not related to academic and clinical performance (g3 .calculation per calendar year is = (g1/(g2-g3). ). On time (G1) = the number of students who graduated according to the published program length. If a student does not graduate according to the published program length, they should not be counted in any graduation rate.
Program length and location for the Doctorate Degree in Occupational Therapy
This program is delivered through a full-time hybrid model, combining in-person instruction and some distance education components. It is eight semesters in length and can be completed in just under three years.
Students most often attend in-person classes Monday through Thursday. Some Friday, evening or weekend hours may be required for the completion of academic and clinical assignments. Students are given ample notice of these required days.
In-person sessions are usually held at Armour Academic Center at 600 S. Paulina, Chicago, IL 60612, which is accessible and designed to support an inclusive and engaging learning environment.
Students are encouraged to review the accessibility features of both physical and virtual learning spaces to ensure their needs are met. For additional support or accommodation requests, please contact the Office of Student Accessibility Services at StudentAccessibility@rush.edu.
Several of our courses have both asynchronous and synchronous sessions. Technology requirements for these courses and the entire program can be found below.
Collaborative strategies are commonly used in the curriculum, which means you need to work with your peers outside of scheduled class periods.
This comprehensive approach aligns with our commitment to excellence in occupational therapy education while providing students with the flexibility and resources needed to succeed.
Download our information packet to hear from our chair and program director, meet our faculty, learn about our program highlights, and find answers to frequently asked questions about the program.
Affordable tuition for the Occupational Therapy Doctorate program
We know your education is a big investment. We want to make sure you have all the information you need to make the best financial decisions for you and your family.
Tuition for the Occupational Therapy Doctorate program is $15,944 per term.
We do not charge additional fees. There are other costs to consider when applying for financial assistance, including the following:
- Books
- Supplies
- Rent
- Utilities
Tuition is subject to change.
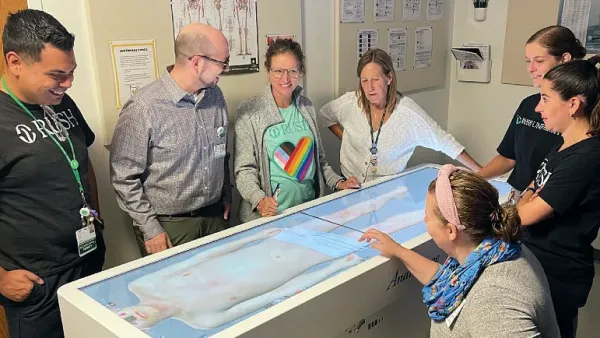
“Anatomage tables are a great tool to help supplement the content that first-year OTD students learn from anatomy lectures, discussions and cadaver lab sessions."
– Lauren Simons, second-year student and anatomy tutor
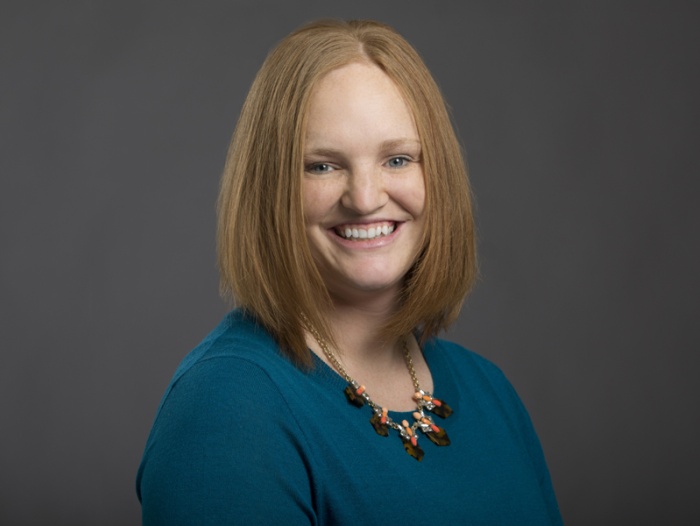
“We’re striving for excellence and innovation in everything we do, and without technology, we wouldn’t have the opportunity to be leaders who are advancing the profession of occupational therapy."
– Becky Ozelie, DHS, OTR/L, FAOTA, OTD program director
Get involved: Student Occupational Therapy Association
The Student Occupational Therapy Association (SOTA) is a national organization for graduate students pursuing a career in occupational therapy. The mission of SOTA is to promote the value of occupational therapy services to the public and other healthcare professionals and enhance the quality of the students’ educational experience through local and national advocacy, community service and professional development.
Career opportunities with a Doctorate of Occupational Therapy
Graduates have a 100% employment rate within six months of graduating.
They have accepted competitive positions in the Chicago area and across the country in the following settings:
- Community-based agencies
- Educational settings
- Hospitals
- Private practices
- Rehabilitation centers
- University clinics
Employment of occupational therapists is expected to grow 17% through 2036, according to the U.S. Bureau of Labor Statistics. This is much faster than the average of other occupations.

Sarah Pyle was born at Rush University Medical Center 28 years ago. Exploring her varied interests, from music to swimming, led to discovering her dream profession in occupational therapy – and that road led her back to Rush.
 College of Health Sciences
 College of Health Sciences
 College of Health Sciences
 College of Health Sciences
 College of Health Sciences
 College of Health Sciences
 College of Health Sciences
 College of Health Sciences
 College of Health SciencesEmerita Professor of A. Watson Armour III and Sarah ArmourDepartment of Occupational Therapy
 College of Health Sciences
 College of Health Sciences
Follow us on Instagram at rush_otd_2be
Learn about upcoming sessions and events in your field of interest.
Sign up to receive more information about this program.